Categories
Airports

KAPA & KBJC: Updated Monthly Operations Data

A new month is approaching, and residents along the Front Range are continuing to be heavily impacted by excessive flight training.

In the last decade, there has been a big push for consolidation of flight schools. Private Equity is investing in these businesses, and making extra profits by concentrating activities to just a few airports. So, if you happen to live near an airport that draws its students from across the nation and even from Asia and Europe, FAA and industry players feel this is just your poor luck. The schools (and elite investors) are happy, and FAA does a great job enabling this concentrated abuse, while staying mum and not advocating for any balance or mitigation or justice.

This year, is proving to be horribly impactful for people near two towered airports south and west of Denver: Rocky Mountain Metropolitan Airport (KBJC), and Centennial Airport (KAPA). This Post provides the latest compilations of monthly operations data for each airport, from January 2017 through September 2023. October’s data is not available until late November, due to FAA delays in sharing data they are fed by all towers every night; also delayed if your local airport authority refuses to get the data from the local tower, and share it ahead of important meetings. So, when monthly airport meetings come up, those concerned citizens who attend are handicapped for lack of current and timely data.

Wouldn’t it be nice if FAA advocated on behalf of the resident population, by urging (or even requiring, as an obligation to receive federal grant monies?) airport authorities to post timely data online ASAP, ahead of events where citizens can engage? Wouldn’t it be nice….

For KAPA, the September 2023 operations changes (versus September 2022) are:

  • Itinerant: down 2%
  • Local: up 41%
  • TOTAL OPS: up 17%

For KBJC, the September 2023 operations changes (versus September 2022) are:

  • Itinerant: up 15%
  • Local: up 9%
  • TOTAL OPS: up 11%

Click on this link to download the KAPA ops data, or this link for the KBJC ops data.

20231030.. ATADS monthly 2017-2023 cn42KAPA
20231030.. ATADS monthly 2017-2023 cn42KBJC
Scroll over the PDF above to activate the PDF viewer controls at the bottom; page-scroll with the arrows in the bottom left corner, or use +/- to zoom in/out.

Categories
AvImpact-Noise

What Do We Need from FAA to Mitigate Aviation Impacts?

This Post returns to the impacts around KAPA, but also discusses JFK Airport (KJFK). These two airports offer an excellent example of the two largest impacts FAA is currently having on residential neighborhoods in the U.S.: ‘concentrated & repetitive’ closed pattern work associated with flight schools at KAPA, and ‘concentrated and repetitive’ arrival and departure streams associated with NextGen procedures and especially intense at KJFK and other larger commercial hub airports.

This Post also attempts to identify key elements of what we, the people, need from the federal regulator in charge of this system and its amplified impacts.

Click on this link to download the 5-pg PDF, for viewing offline, and feel free to share it onward.

20230731.. From the Oceans to the Mountains, What Do We Need from FAA to Mitigate Aviation Impacts (aiREFORM, 5p)cn2101
Scroll over the PDF above to activate the PDF viewer controls at the bottom; page-scroll with the arrows in the bottom left corner, or use +/- to zoom in/out.

Categories
AvImpact-Noise

Flight Training Impacts at KAPA & KBJC: An Analysis of the July 7th Denver Post Article

Below is a PDF copy of the text for a good article, published in the Denver Post, on July 7th. The writer, John Aguilar, provides a deep news compilation on how residents are severely impacted by airport operations at and near Centennial Airport (KAPA), and the Rocky Mountain Metropolitan Airport (KBJC).

This analysis by aiREFORM goes further. It is a markup of the Post article, with footnotes that expand on (and in a few cases clarify or correct) portions of the article. The goal of this analysis is to aid readers in better understanding the impacts. It is also to help more people navigate past the obstructionism and confusion seeded by FAA, the airport authorities, AOPA, and other aviation parties.

Click on this link to download the 10-pg PDF, for viewing offline at your leisure.

Use the embedded PDF below to read the PDF online; dwell on the bottom left corner of the PDF to use up-down arrows (for page scrolling) or to zoom in/out.

20230707.. Suburban residents battle noise, lead pollution from busy metro Denver airports (J.Aguilar, DenverPost, 10p,markup)cn42-KAPA

Categories
Airports

KAPA: FAA and Mike Fronapfel Need to Be More Transparent

Click on this link to download the 5-pg PDF.

20230511.. FAA and Mike Fronapfel Need to Be More Transparent (zz32KAPA, 5p)

Categories
AvImpact-Noise

In Letter to CACNR, FAA Regional Administrator Grady Stone Concedes Pattern is Elongated but Falsely Claims Traffic Volume is the Reason

Centennial Airport (KAPA, southeast of Denver) is one of the current top five impacting airports in the U.S. These are general aviation impacts, caused by small single-prop and twin-prop planes staying in the pattern and doing touch-and-goes to the west parallel runway (runways 17R/35L).
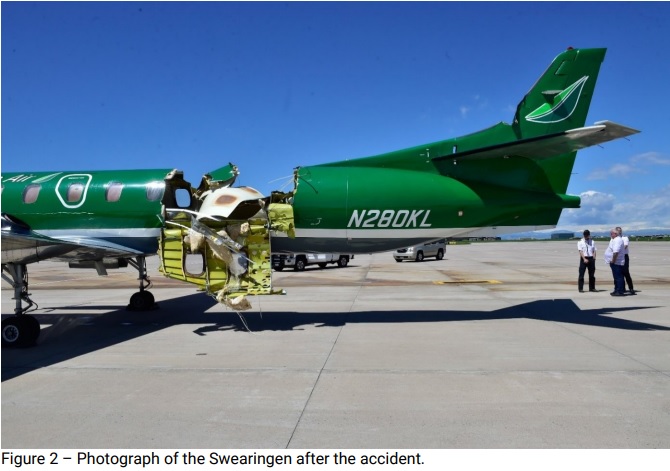
Back in May 2021, there was a midair collision when a Cirrus arrival to 17R overshot the final approach course (the line extending north of runway 17R); its prop slashed a series of cuts into the top of the fuselage of a KeyLime metroliner on final to land runway 17L. Amazingly, nobody was killed.

It is one thing for a midair to happen far from an airport, when two planes just randomly meet. But, this midair was particularly troubling, because the flights were being controlled by KAPA tower controllers. Through complacency, they failed to actually work the 17R arrival; they failed to apply positive control by extending the Cirrus on the downwind for just a few more seconds, and they failed to assure the pilots actually saw one another.

This failure triggered a reaction by FAA management: complacency was to be checked, and positive control was to be rigorously applied. But, no policies were implemented to actually LIMIT the number of aircraft in the pattern. Thus, abandonment of the near-lethal complacency standard forced KAPA ATC personnel to extend the overfilled 17R pattern to the north, impacting residents below.

Here’s a screencap showing two hours of KAPA flights last December. 
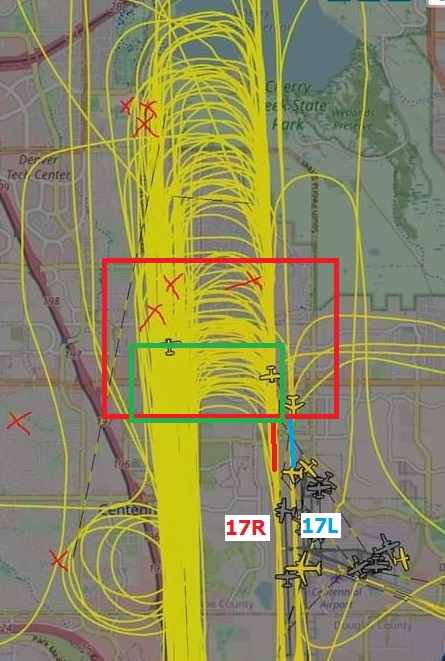
It is an ugly picture, but the numbing and incessant drone is even uglier. A red box has been added, outlining the region where base turns would happen in a pattern not overfilled with too many flights. Note the current 17R ‘pattern elongation’ extends miles further to the north, even over the reservoir. Note also that, if ATC chose to reduce risks and limit the number of aircraft staying in the 17R pattern, the base turns would be mostly confined to the smaller green box, much closer to the runway… and the impacts on residents would be significantly reduced.

This is the core frustration thousands have with FAA, CACNR, and the airport: the impacts are huge, and nobody is cooperating to mitigate the impacts.

More than two months ago, FAA attended a Centennial Airport Community Noise Roundtable (CACNR) meeting, on February 1, 2023. Questions then produced this 9-page letter from FAA Regional Administrator Grady Stone, to the CACNR Chair, Brad Pierce.

The letter is long and dry and somewhat confusing. Many of the FAA answers refer back to earlier answers, which tends to diminish letter comprehension. To fix this problem, a modified version of the original letter has been created; content has been reformatted, and each question and FAA answer is provided within a table. Reference portions have been added using a smaller red text. Two dominant response ‘themes’ have been highlighted in color: FAA’s declaration that they did not change how the KAPA traffic pattern is managed (oh, really?!?), and FAA’s assertion that they lack authority on many aspects of air traffic management such as making decisions about numbers of operations (yeah, right!!). Use these links to view copies:

  • [link] to view the modified version of the original letter, or
  • [link] to view a PDF copy of the original 9-page letter.

There was a third dominant response ‘theme’ in the FAA letter, and it is a doozy: a false claim that the KAPA traffic pattern has ‘elongated’ due to increased traffic volume. This is interesting. While the bulk of the letter is just repetitive denials by FAA, within the letter FAA does concede REPEATEDLY that, yes, the traffic pattern has elongated. But, instead of also conceding the cause of elongation we all know (reaction to the May 12, 2021 midair collision worked by the KAPA control tower), FAA insists traffic volume is the cause. As the Analysis below clearly shows, FAA is wrong, and FAA is lying.

A PDF copy rebutting FAA’s false claims about increasing traffic volume at KAPA is embedded below; move the cursor to the bottom left corner and use the up-down arrows to scroll through the three pages.

20230413.. Debunking false detail in ANM.RA.G.Stone’s letter, KAPA ops counts are solidly down (zz32KAPA, 3p)
Scroll over the PDF above to activate the PDF viewer controls at the bottom; page-scroll with the arrows in the bottom left corner, or use +/- to zoom in/out.

Categories
AvImpact-Lead

[KAPA]: Monthly Fuel Flowage Data for 2021

Data was recently obtained by activists impacted under the flight training ‘closed pattern’ at Centennial Airport [KAPA]. The data shows ten years of monthly fuel flowage figures, both in gallons and revenue dollars; it is all compiled into the spreadsheet below:KAPA.20230327.. Fuel sales & revenues by month for CY2021 (1p)

Background:

At most General Aviation (GA) airports, the two largest revenue sources are leases (for hangars, land, or parking spaces), and the ‘fuel flowage fee’. This is an amount, commonly between a nickel and a dime per gallon, supposed to be assessed on all fuels dispensed at the airport. As such, the fuel flowage fee revenue data provides a valuable metric for evaluating airport activity. Sadly, airports often make it difficult or impossible to get this data. Fortunately, this time, the data was produced.

Something Unusual: the Airport Authority reduced fees and took a large revenue loss

Starting in 2018, the airport authority chose to reduce fuel flowage fees by roughly a third. This was an odd ‘business’ move, a huge gift to pilots that reduced airport revenues. In the first year, fuel flowage fee revenues dropped 30%, while volume sold went up 5%. For the four years 2018 onward, versus the six years prior to lowering the fuel flowage fees, there was a 25% decline in revenues and ~12% increase in fuel sales.

Questions Raised by the Data

  1. for the AvGas portion, the data indicates that, in an average year, as much as 2,900 pounds of lead are dispensed for use by KAPA aircraft. Can the airport authority clarify, precisely how many gallons of unleaded fuel were sold during each month of the past ten years? (i.e., what percentage of the avgas sales data were for 100LL, versus other types of avgas)
  2. what was the intent (as articulated by airport management and/or the Board) and the reason for the reduction in fuel flowage fees in 2018?

Suggestion for Improving Airport Transparency

Fuel flowage fee revenues and other metrics should be shared by each airport authority, with their impacted communities. FAA would do well to mandate this type of transparency, especially regarding data that quantifies aviation impacts.